


An Objective Review of Warren Buffett's Fund
No fund manager is safe from this blog


Intro
Often referred to as “The Oracle of Omaha”, Buffett’s been running money for over half a century through Berkshire Hathaway (referred to as BH from here onwards, not to be confused with Brevan Howard), and beaten the S&P 500 by about 10% per year on an annualised basis, alongside his partner Charlie Munger. He’s admired by millions globally, so based on these 2 facts we could say “he’s great, case closed.”
Though similar to the Cathie Wood Fund Review I wrote, I think it’s important to try and explain the performance of the biggest fund managers, because so many people’s future depends on them. So here goes.
Methodology
Download Berkshire Hathaway annual reports from here. It includes S&P 500 returns and BH’s returns on an annual basis.
Put the performance data into Excel, split it by x3 20yr segments (this will make sense shortly), and run some numbers.
Results
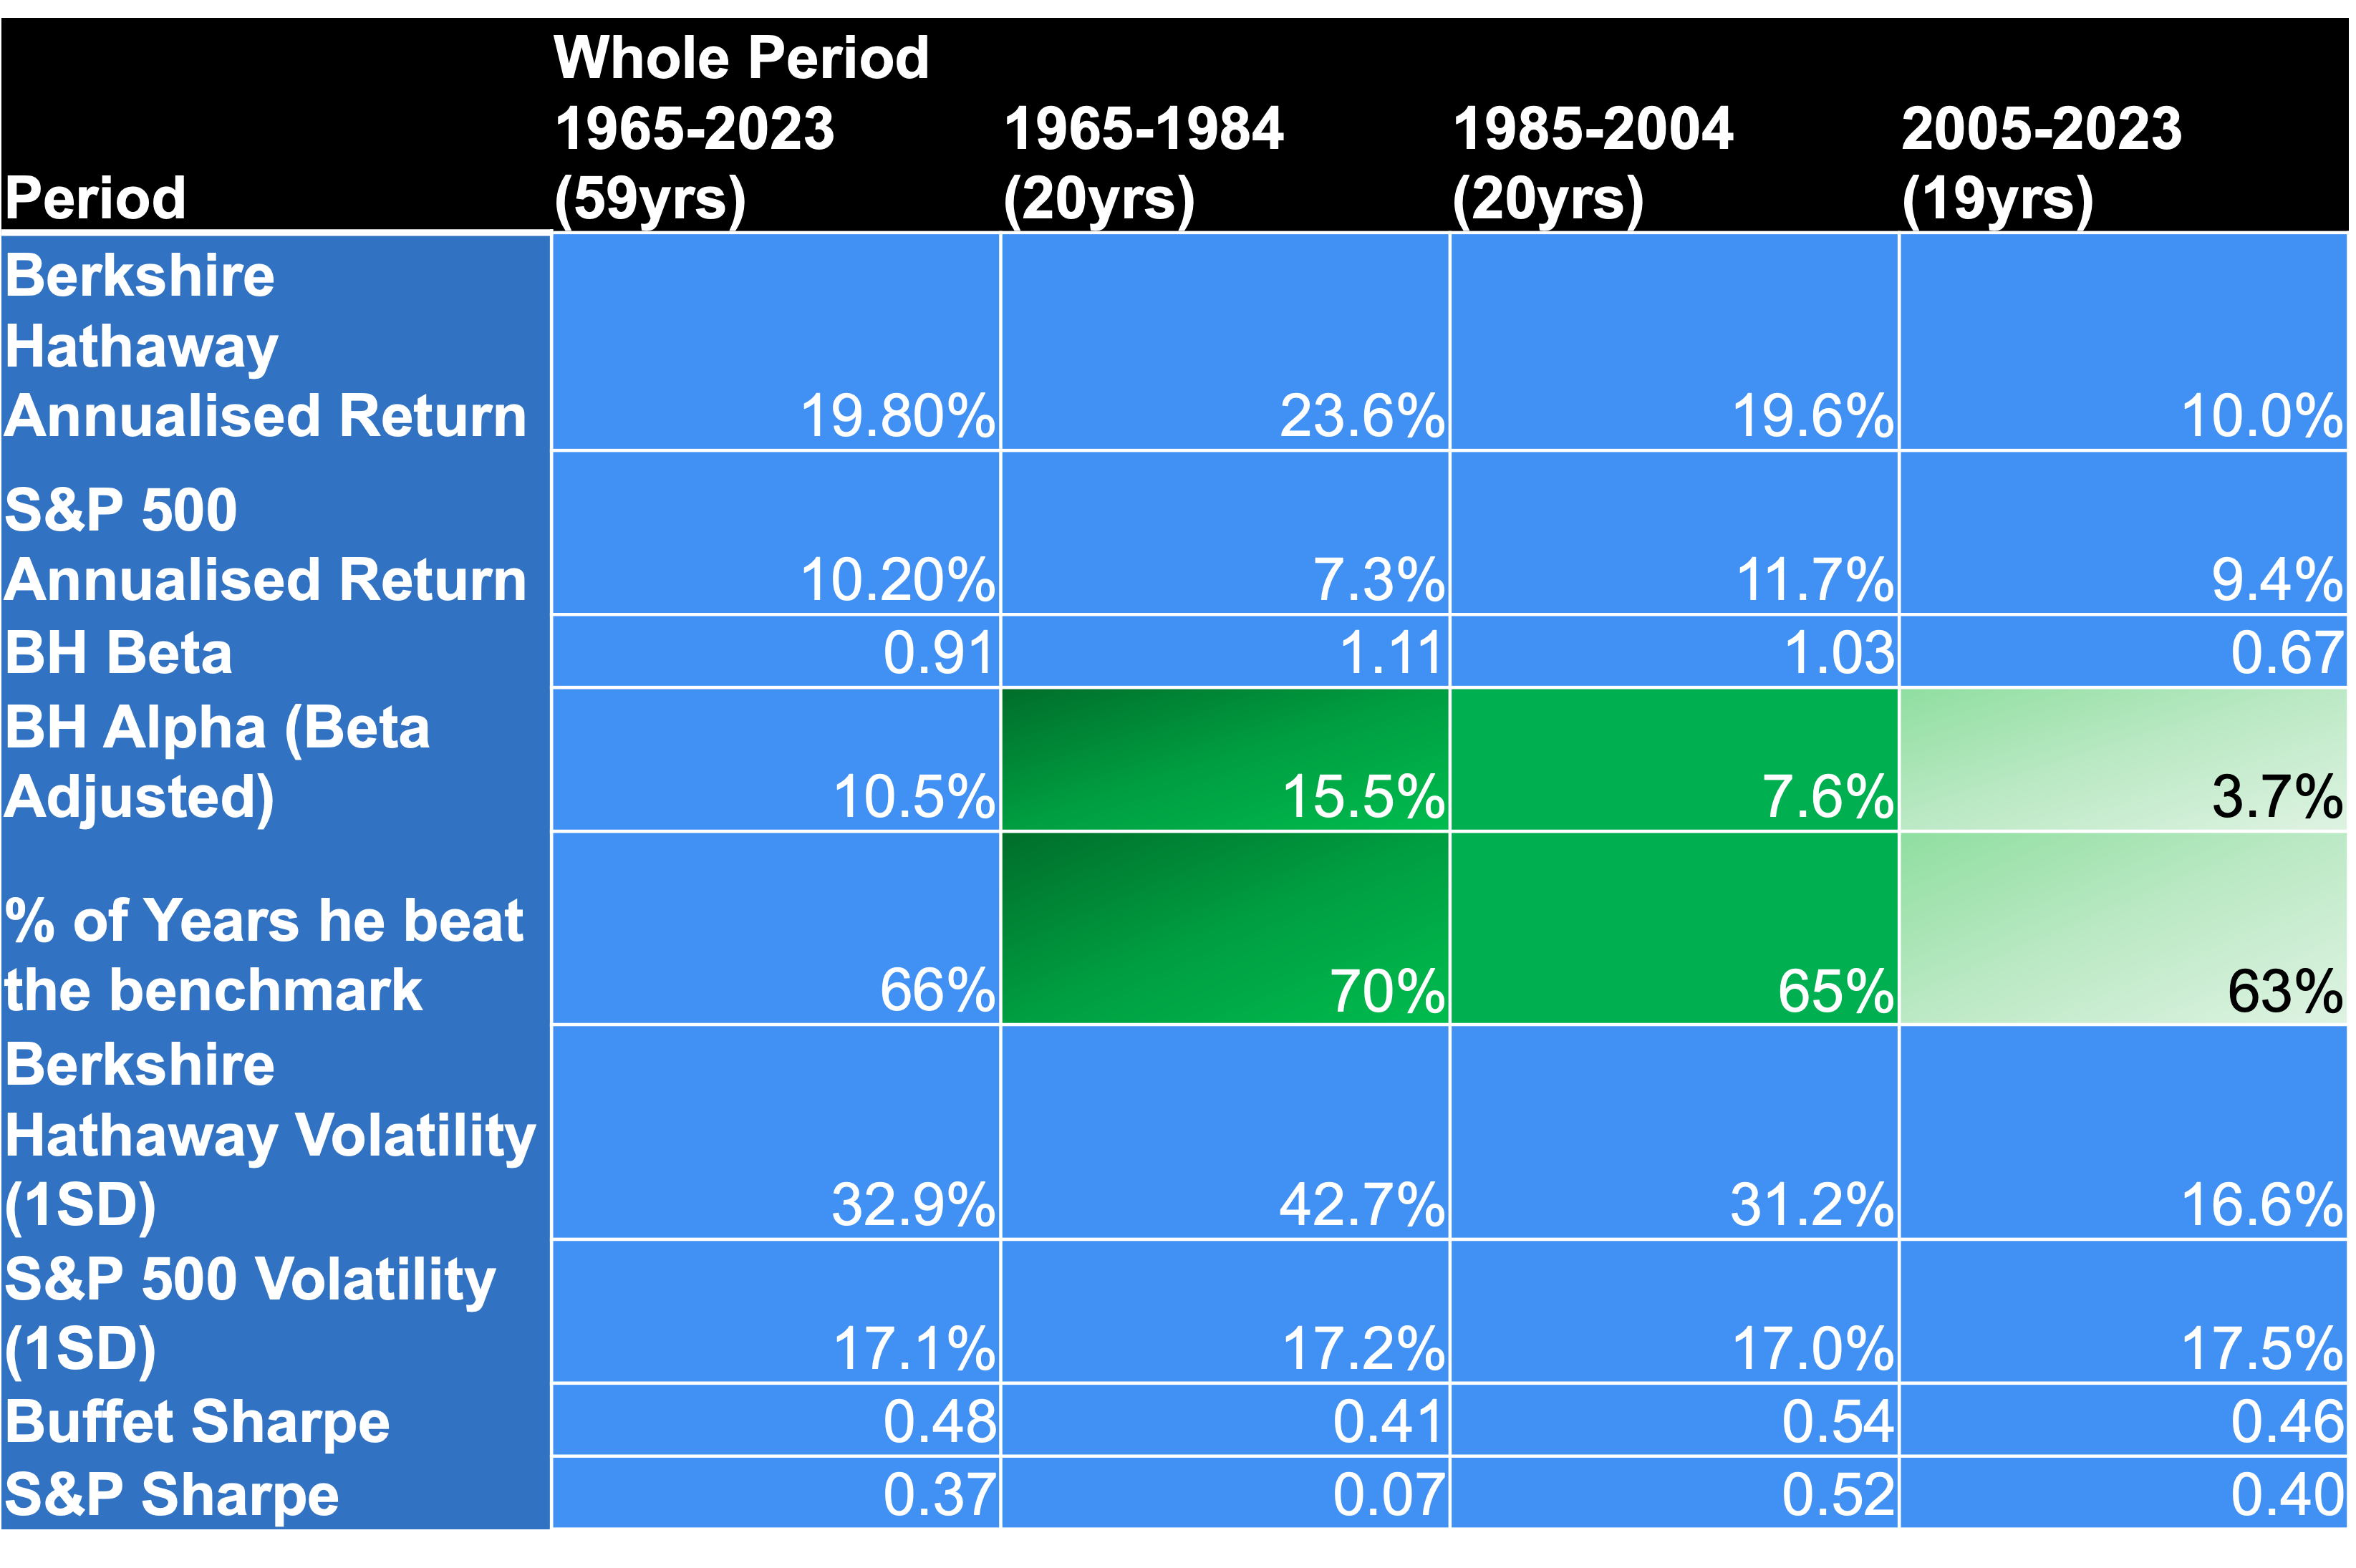
Observation 1: The guy is great in multiple metrics
Here’s the things which stand out to me:
He’s consistently beaten the S&P. on average 2/3 years he’s ahead (see % of Years he beat the benchmark row).
He’s consistently found Alpha (see BH Alpha). Suggesting his style works in a variety of different environments.
He’s a better risk manager than a passive index (see Buffett Sharpe vs S&P Sharpe). No where near Millennium’s 2.6 Sharpe, though they’re playing a very different game so that’s expected.
Observation 2: His Edge has diminished overtime
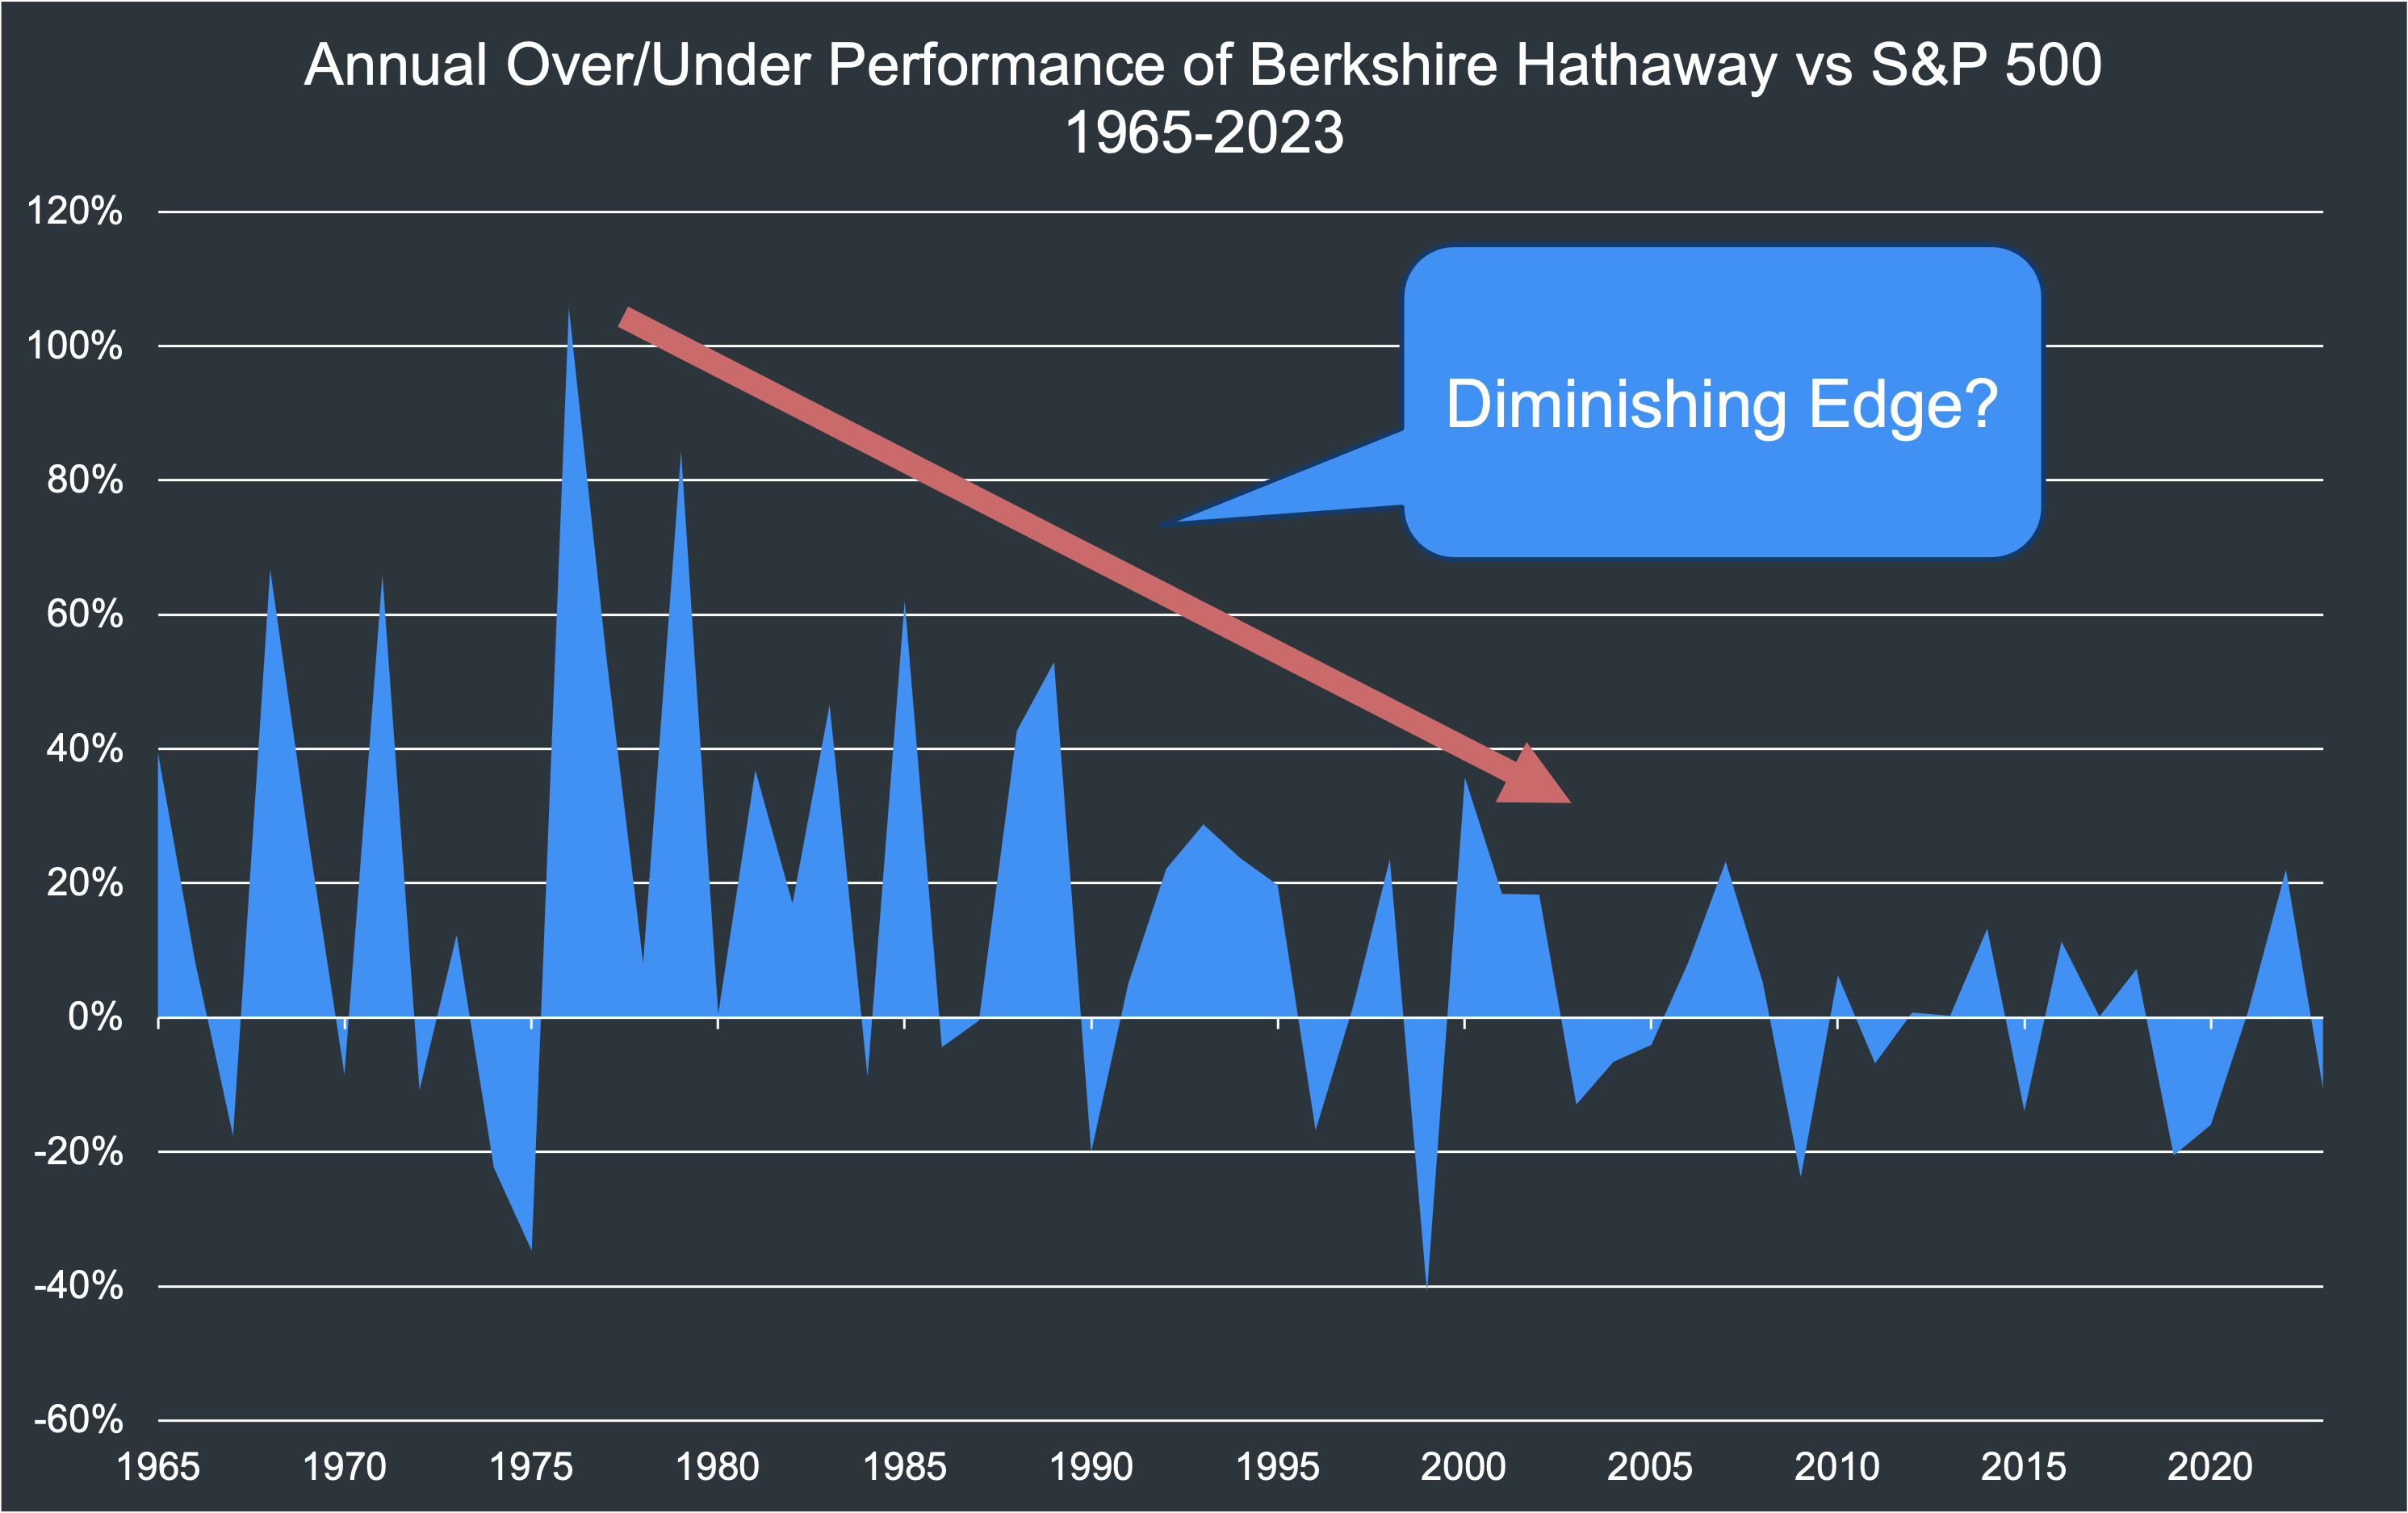
His Alpha went from 15.5% to 7.6% to 3.7% over each consecutive 20yr period, including 3 consecutive years of underperformance between 2003-2005. You can see this outperformance decline visually above. Now there’s lots of different reasons you could suggest though I’m going to focus on just 1. Size.
1994 BH Equity = $21.3bn
2023 BH Equity = $1.07tn
That’s 50x in 30 years. Multiple times higher than inflation.
Practically speaking this means his universe of stocks is much smaller than in the 1960’s/70’s when he was delivering huge Alpha, because he can only invest in large or mega cap stocks today to make a meaningful difference to his returns.
It’s often Small Cap stocks which have less Sell Side Coverage, and thus where more Alpha can be found (hence the Size Factor, see Fama French, 1993). This diminishing edge due to his growing asset base, is also supported by other research which shows smaller funds outperform their larger peers (see García and Vidal, 2021). So how can we learn from him and Charlie’s experiences?
Recommendations to Investors
Accept Underperformance
Even The Oracle underperformed his benchmark 1/3 years. So one should expect some years to be ahead, some years to be below. And that is markets. The idea of consistent Alpha year on year, is very challenging to deliver. Thus rather than trying to time when a fund manager will underperform and disinvesting, it’s likely best to just stay invested and leave them to it (as hard as this mentally is).
Pay Attention to AUM
Similar to the question of “who is the best wife/husband for me?” the optimal size of assets to run in a fund, is impossible to know definitively. There’s just too many variables at play (e.g. size of market they trade, average daily volume of instruments they trade, time horizon of typical trade etc).
Though what Fund Managers and Allocators can do, is work out if the fund in question is amongst the biggest or smallest in the peer group. Because based on the evidence any fund in the top 20% largest of its peer group, will have an inherent negative edge versus the smallest 20%. Call it diseconomies of scale, you see it in all fund managers and strategies globally.
Conclusion
Is Buffett brilliant? Yes. Many metrics support that. Though it’s important to realise that success almost certainly leads to diminishing returns, because as a Fund Manager performs well they attract more fund inflows, which then reduces their edge.
Hope you found this useful
Chris
Great!