


Where Bond Yields are heading, based on 500 years of data
This time is not different


Intro
Having recently finished a History of Interest Rates that covers 5,000 years of rates history, it became apparent that bond yields move in multi decade cycles/trends. Now the latest edition of the book was put out in 2005 and since then, there’s been further research on long term yields and the lowest rates seen, well, ever (see chart below).
Similar to the film Tenet pictured above, we’re going to go back in time. Combining and updating the data, to try and draw insights. Just to clarify we’re focusing here on long term government bond yields (US 10 Year Yield at present, perpetuals of Britain and Italy prior) of the dominant powers/countries with the largest GDP over the centuries.
This is because the majority of bonds will be denominated in that country’s currency (e.g. USD) and many other securities will either be priced explicitly or implicitly off the dominant power’s yield. So get the US 10 Year right, and you’re pretty much good to go.
Methodology
As always long evidence, short stories though given how large and complex the datasets used are, I’ve had to make x2 judgement calls which I’ve explained below.
I start with p562 of a History of Interest Rates, which provides a table of these trends from 1737-1974 (call it 250 years).
I then add x2 other data sources, Paul Schmelzing’s seminal piece to provide data for 1500-1737, and a simple Federal Reserve database pull for 1974-present. The time series is using yearly average yields.
Based on Schmelzing’s data which also provides GDP estimates between 1500-present, I focus on covering the bond yields of the dominant power/the country with the largest GDP (rounded to the nearest century). In practice this means:
Italy = 1500-1700 (see judgement call 1)
UK = 1700-1900
US = 1900-Present (see judgement call 2)
Judgement Call 1: Choosing Italy instead of France as the dominant power
Italy had the largest GDP at the start of 1500, though then got overtaken by France and became the 2nd dominant power. I have decided not to use French yields as they had x4 defaults during 1500-1700 (see This Time Is Different Data), thus leading to some explosive rises in yields. This makes them less comparable to the UK’s or US data, who had not experienced defaults during the periods covered.
In essence, I had to choose between no. 1 GDP status vs default free consistency with the rest of the data series, to which I chose the latter.
Judgement Call 2: Calling 2020 as a cyclical low in yields
Based on 500 years of data, 2020 looks like a cyclical low. The length and size of move seems comparable/in line with the rest. Moreover if one assumes 0% is the floor of the US 10YR (unless Powell makes a slip on his keyboard and accidentally buys a few trillion of bonds), then we can’t get much lower yields mathematically.
The Data
Just so we’re all on the same page:
Table 1 = The data powering Chart 1 above, green means cyclical low and red cyclical high
Chart 2 = A histogram showing how long bond yield trends typically last
Chart 3 = A histogram showing how large the move in basis points typically is

Length
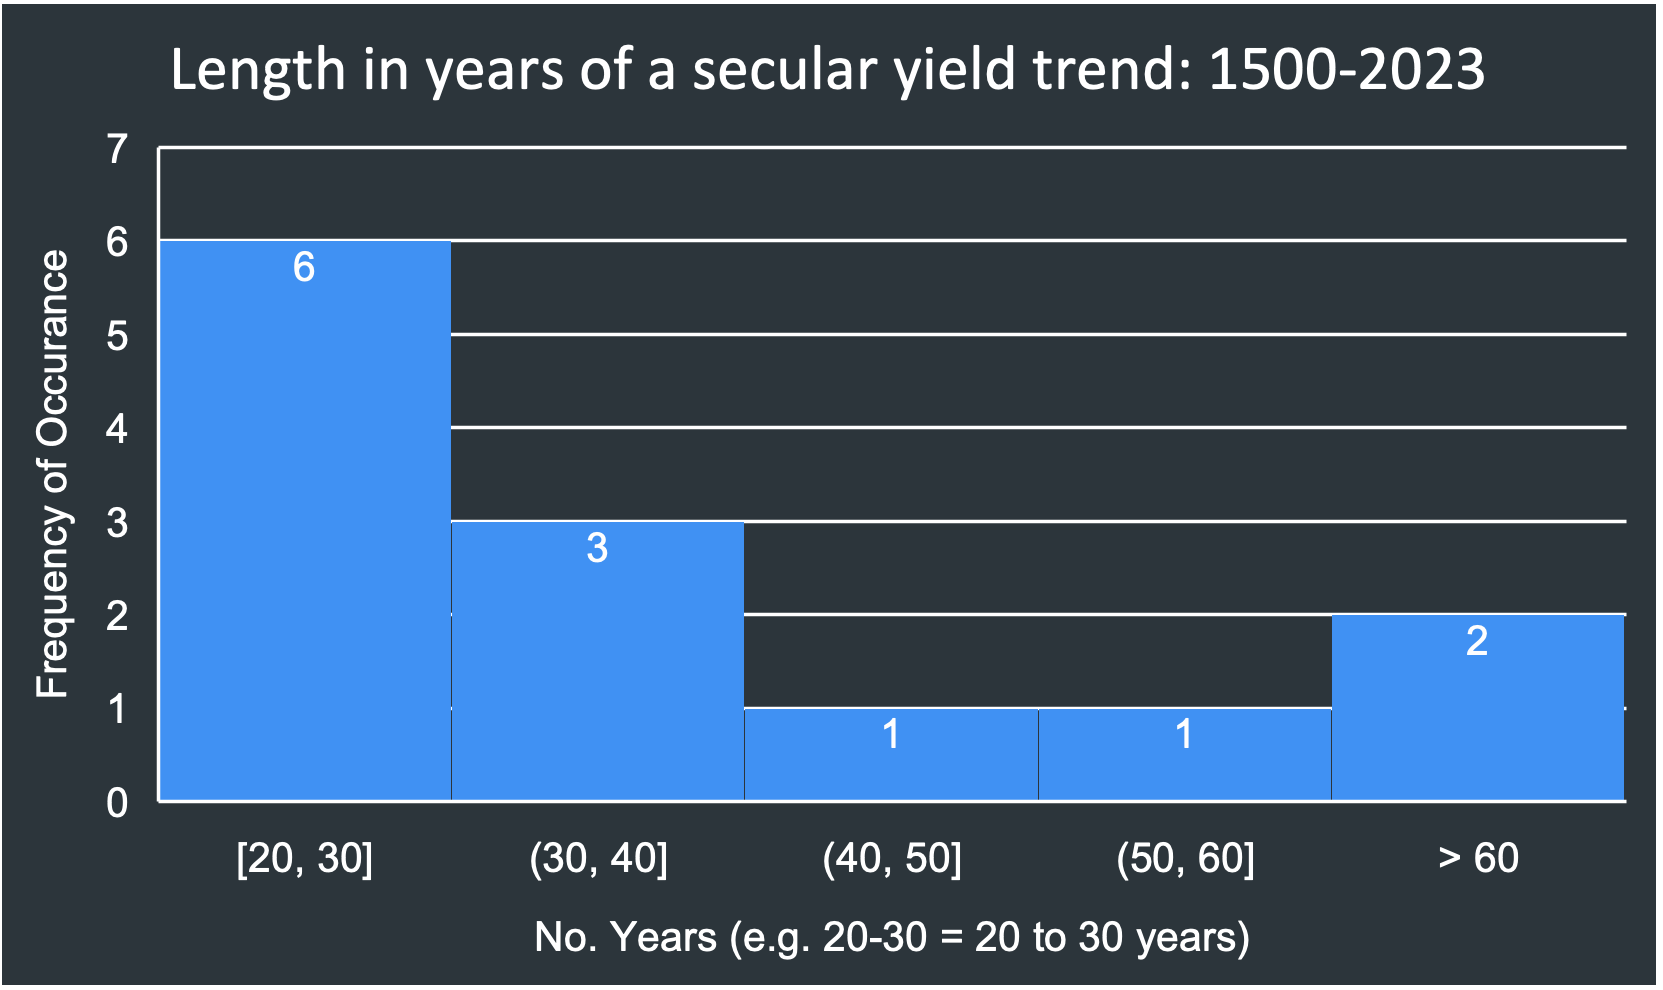
As you can see in the histogram, they typically travel in a similar direction for 20-30 years, though having gone through the data extensively can easily have reversals of 1-2 years or longer in length. This means you could easily have the right long term positioning, though end up stopped out of trades or underperform your benchmark for a couple of years (by taking more/less Duration exposure than your benchmark). Basically over 10 years you’ll look like a hero, over 2 years you could look like an idiot.
Size

Based on the histogram, a typical move is between 3.5-6.5% in either direction from the cyclical high or low, though again can easily be much bigger. The smallest move was 307bps (1920-1946). Basically however you cut the data, mortgage costs are probably going higher (bad for the younger generation) and finally retirees can earn a sensible yield on their assets (good for the older generation).
Recommendations to Investors
We’re going higher
In what might be my first ever Macro call on this blog and as always not financial advice:
Based on the past 500 years of data, it seems we are now in a secular uptrend in bond yields, which could last at least 2-3 decades and result in 3.5-6.5% higher yields than the low in 2020, of 0.9%.
If this call is right (which it might not be, and if so I will update the research), long term you want to structurally take less duration risk, which in english typically means buying bonds which aren’t as long dated as before. That said, you can easily have short term reversals which we probably are facing now (see US 10 Year Yield from November 2023 onwards). So have fun market timing.
Hope you learnt something new
Chris