


How much could Quantitative Tightening impact Bond Yields? The US Case
It's only a few trillion

Note: This article was originally published by Evenco International here. It was produced by me and edited by Evie Ratnaventhan. They have gratefully allowed me to share on here too.
Understanding the Fed's Role in Bond Markets
Over the years, the Fed has bought several trillion in Bonds. Since June 2022, however, they’ve been selling. So why does this matter? Well, if you take a look at the chart below, you can see they are one of the largest holders of Government Bonds, constituting about one-fifth of the total value at present.

Quantifying the impact of this selling on bond yields is crucial. Can we provide a straightforward numerical estimation without relying on complex models or expensive licenses? Let's give it a shot.
Methodology
Get monthly US 10 Year Yield data (referred to as the 10YR onwards) from here. Then pick 2 simple, freely available variables at the Fed’s database to predict it being:
10 Year Inflation Expectations (our dominant variable, given it has a 0.92 correlation with the 10 Year Yield, see visual below)
The Value of US Nominal Treasury Bonds held by the Fed (not their overall balance sheet, specifically their government bond holdings because this has less noise)
Use some simple machine learning (linear regression) to try and put a number on how much the Fed’s buying/selling moves the 10YR, relative to the other variable.

Results
With just those 2 data points, we’ve been able to produce a model which explains more than 80% of the variability in the US 10 Year Yield (R2 = 0.84). The degree of error in the predictions (mean absolute error) is +/- 0.35%. Meaning if the model predicted 4%, on average we’d expect the 10YR in reality to be between 3.65% and 4.35%.
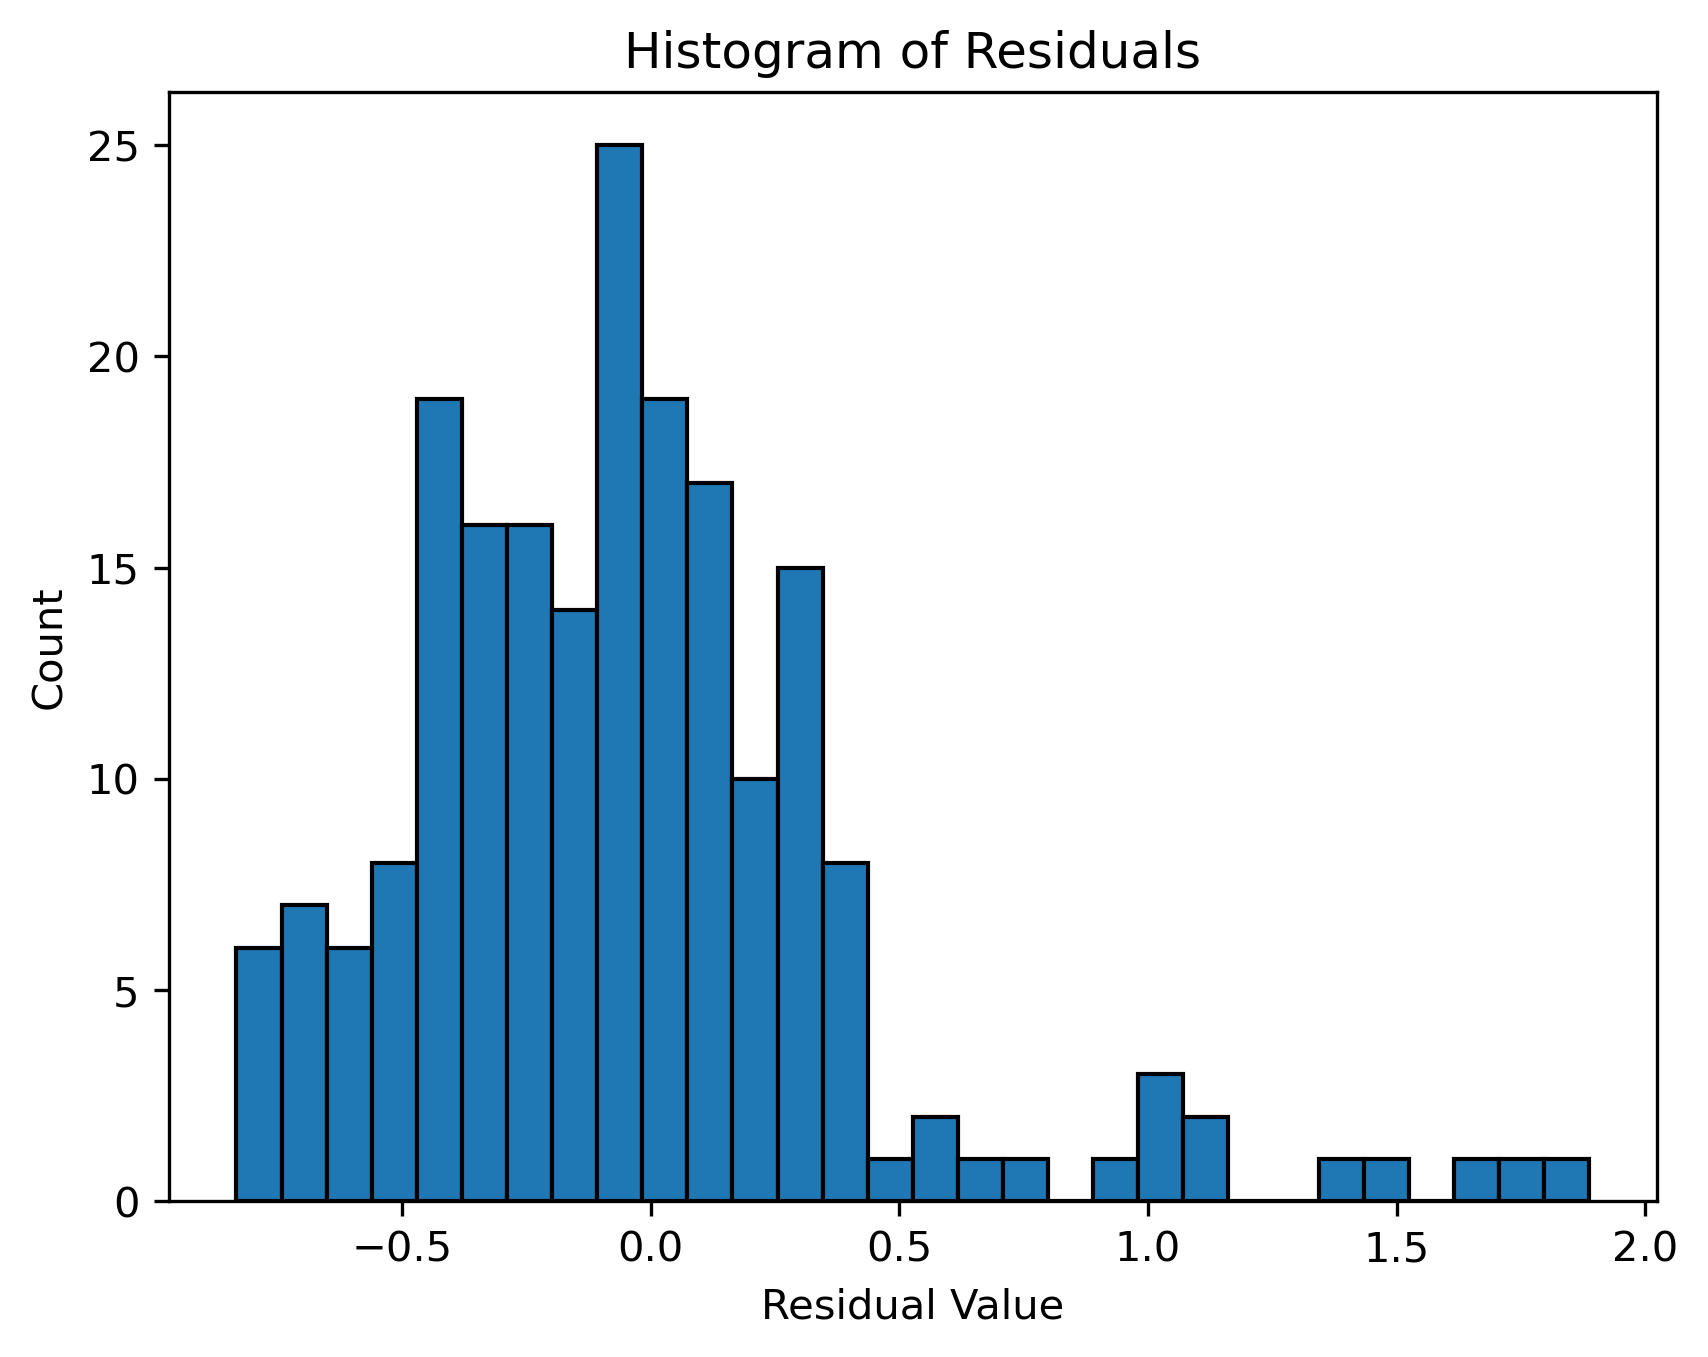
Can we make it even more accurate? Probably yes, because based on the residuals diagram below, the model is more likely to over-estimate rather than under-estimate, as most residuals fall below zero. So best to subtract that 0.35% from our predictions, rather than add it.
So now we’ve covered the caveats of the model, let’s give you the answer you’ve been waiting for. How much does Fed selling impact yields?
· Inflation Expectations = 1% rise leads to a 1.83% rise in the 10YR.
· Quantitative Tightening = $1tn in selling leads to a 0.30% rise in the 10YR.
· If Inflation Expectations were to fall or the Fed were buying instead, you’d see the opposite move (e.g. 0.30% lower 10YR)
At the time of writing they hold $4tn, implying a complete sale would raise the 10YR by 1.2% (0.3% * 4). It’s currently at approximately 4.2%, so that would roughly translate to 5.4% (though we know our model typically undershoots).
Bear in mind this is quite simple and does not account for market dynamics. For example if Powell did literally hit the sell button on $4tn tomorrow, the rise in yields would be far greater given that the average daily volume is $0.9tn/there wouldn’t be enough buyers. Though he’s a Central Banker and not a foreign sleeper agent like Angelina Jolie in Salt, so unlikely to do that.
Recommendation to Investors - Follow the Unwind
The reason I use the word "follow" is because it requires zero macro forecasting unlike Inflation Expectations, as they explicitly state the amount planned for on their website (for reference last year’s average was $53bn of nominal treasuries per month). Additionally, if you wanted something more real time you can track the level of selling weekly (data is released every Thursday). Hence, short-term Rates Traders might not find this information particularly useful (as, based on our model, it moves the 10-Year yield higher by about 1.6 basis points a month, which wouldn’t cover the bid/offer spread).
Therefore, Quantitative Tightening is more of a long-term theme for investors making Strategic Asset Allocation (SAA) decisions for the next few years. Given that if the Fed continues selling at the current rate, it will take them approximately 6 years to clear their nominal treasury holdings.
Hope you found this useful, and have fun front running The Fed
Chris