Absolute Return Investing Part 2: How to increase the odds of making money
You don’t need to be from X-Men to pull this off
Intro
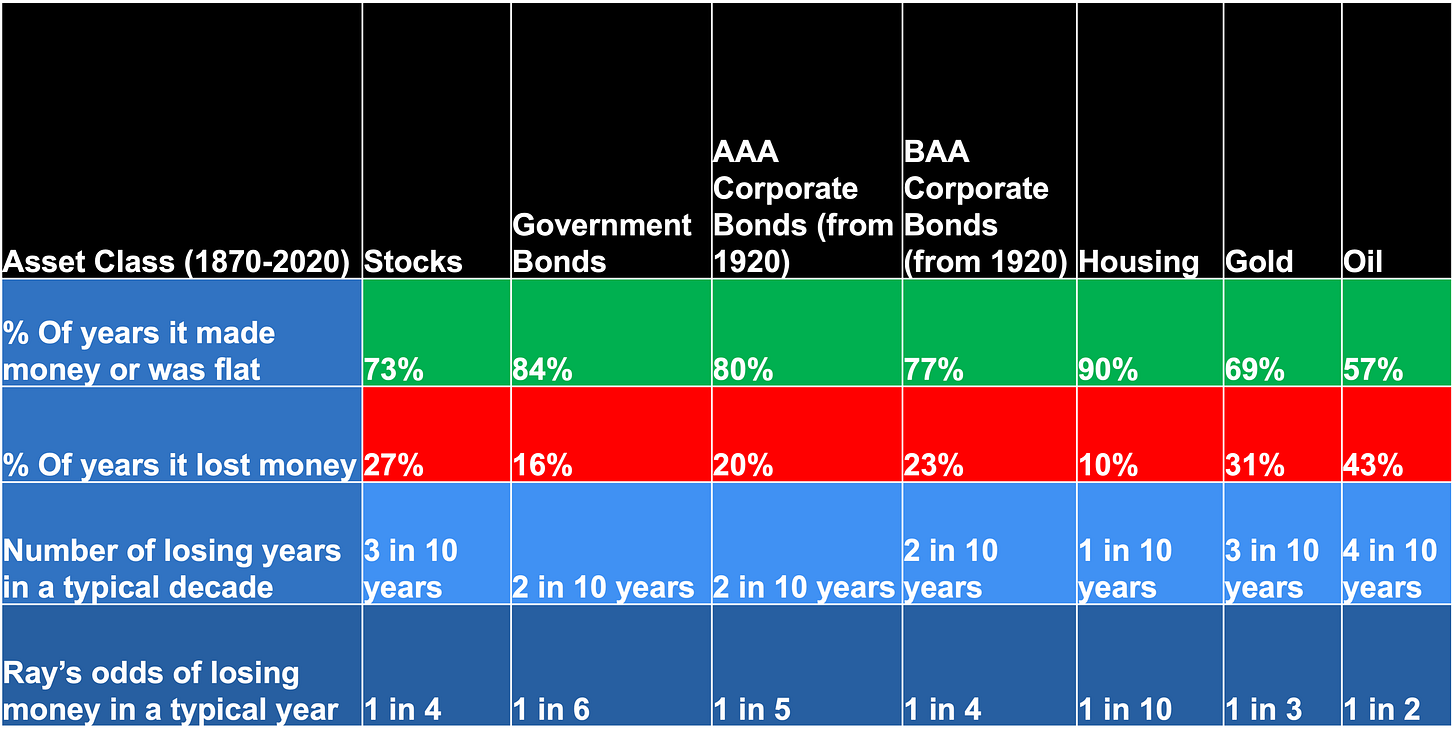
Firstly, thank you all for the feedback on the previous piece (link above). For a quick recap here’s the key table below, summarising the odds of delivering Absolute Returns in any given year, based on 150 years of data.
So can we improve our odds of making money? I imagine Charles Xavier from X Men might be able to, though he’s not real. So I’ve come up with 3 ways you can increase your chances of making money/improving your edge, using the same dataset as before. We’ll also continue quoting Ray’s odds to make it crystal clear.
Beware the Double Negative
As mentioned in the prior article, shorting is hard (see row 1 in above table, because all assets produce negative returns < 50% of years). However what you see above is you’re more likely to be right shorting, straight after a negative year for that asset class. In very simple terms:
Stocks have a 27% (1 in 4) chance of going down in a random year. Though have a 35% (1 in 3) chance of going down, if they’ve gone down the year before. Meaning your odds of being right just increased by 8%.
So if you’re going to short an Asset Class, it’s best to wait until its already gone down (implicitly using the Trend Factor). And whilst Contrarian Buying can be highly profitable, know that there’s a good chance you lose money for another year.
Quantify Diversification
Stocks have a 1 in 4 chance of going down in a typical year, Government Bonds 1 in 6. So what are the odds of Stocks and Government Bonds, going down together in the same year? I ran the numbers, it’s 1 in 14 years. So there is logic to a 60/40 Stock/Bond Asset Allocation and I don’t think it’s dead following 2022’s poor performance, which was evidently a rare event.
In the context of Asset Allocation, because Stocks and Government Bonds tend to be uncorrelated in the long term, what you find is running a 20/80 Stock/Bond split delivers positive returns just as well as 0/100 (as shown by both facing the same 1 in 6 odds of losing money in the table above).
So for those in retirement or with Absolute Return benchmarks (e.g. SONIA + or CPI +), having a small allocation to stocks does make sense to boost returns slightly, without increasing the expected number of negative years.
Pay attention to U.S Election Cycles
Given that the U.S makes up about 60% of the MSCI ACWI, if you can predict the S&P 500 right you’re pretty much good to go. Now the table in the intro showed Stocks go up 73% of years, can we improve upon this? Certainly looks like it. In the first 2 years of a Presidency, the average % of positive years for Stocks is 66% (aka 1 in 3 chance of losing money). In years 3 and 4 however, the average becomes 82% (aka 1 in 5 chance of losing money). That’s a 9% edge above our initial odds.
So whilst many implicitly bet against Stocks in 2023/3rd year of the Presidency by buying into money market funds. In the U.S specifically, you had a 1 in 7 chance of Stocks going down based on Presidential Cycles. If after reading this you still fancy those odds by all means, happy to sell you Put Options next time and leave it unhedged (if you don’t get the joke, do dm me).
Conclusion
Simply Put:
If something went down last year, the standard odds of it going down again increases. The odds of shorting it and winning are still unfavourable, though it is slightly more in your favour (e.g. odds of Stocks going down changes from 1 in 4 to 1 in 3).
1 in 14 years Stocks and Government Bonds go down together. A 20/80 Stock/Bond Asset Allocation, produces no more negative years than 0/100, though is likely to deliver higher returns over the long term.
You’re more likely to make money in Stocks in years 3 and 4 of a U.S Presidency, than years 1 and 2.
Why do these patterns exist? Happy to discuss over coffee and a cinnamon swirl.
Hope you enjoyed this, and remember you’ve got a 1 in 5 chance of U.S Stocks going down this year, despite all the negativity
Chris


